1How many use it, month by month
| Month | Median / day | Mean / day | Motor vehicles / day |
|---|---|---|---|
| Aug 2025 | 679 | 658 | 1,215 |
| Sep | 772 | 729 | 1,343 |
| Oct | 504 | 496 | 1,397 |
| Nov | 168 | 207 | 1,458 |
| Dec | 37 | 40 | 1,248 |
| Jan 2026 | 34 | 33 | 1,243 |
| Feb | 34 | 35 | 1,363 |
| Mar | 52 | 54 | 1,396 |
| Apr | 235 | 275 | 1,523 |
| May | 486 | 471 | 1,598 |
| Jun | 750 | 747 | 1,451 |
| Jul | 690 | 678 | 1,312 |
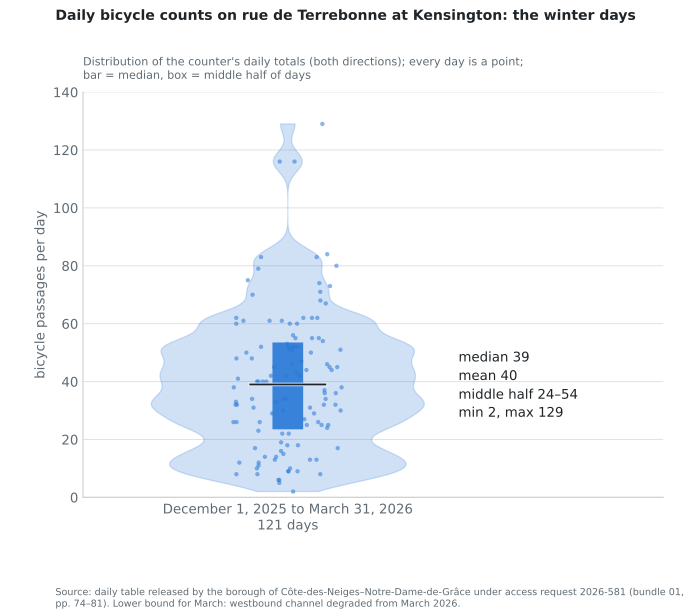
- Winter, December 1 to March 31: 4,891 passages, 40 a day, 121 days, no day without a bicycle (lowest 2, highest 129); usually between 25 and 75 (82 of 121 days).
- Rest of the year: 534 a day. Motor traffic: 1,375 a day over the year, down from 6,300 in 2022.
Source: daily table, access request 2026-581, bundle 01, pp. 74–81. Lower bound: three outage days in May 2026.
2Speeds on a 30 km/h street
| Sensor | Season | V85 (median of hours) | Cars over 30 km/h | Cars over 40 km/h |
|---|---|---|---|---|
| King Edward | Winter | 35 | 27 % | 11 % |
| King Edward | Summer | 39 | 32 % | 16 % |
| Draper | Winter | 34 | 34 % | 6 % |
| Draper | Summer | 37 | 55 % | 5 % |
- With the lanes in place and one 3.5 m traffic lane, the 85th-percentile speed already sits at or above the 30 km/h limit on both segments, in every season.
- Roughly one car in three at King Edward and one in two at Draper passes above the limit; about one in six at King Edward is over 40 km/h in summer.
Source: Telraam S2 sensors at King Edward (west of Cavendish) and Draper (east of Cavendish), hourly data, daylight hours with at least 20 cars; camera-based speed estimates; winter = Dec–Mar, summer = Jun–Aug. Data to 2026-05-04.
3What was said, and what the counter shows
The 8: six peak hours on one day, January 29, 2025, from a temporary camera at Grand. The 700: a September count (707) on a different slide, all four approaches; like for like, the slides give 97–98 %.
4,891 ÷ 135,276 = 3.6 %: winter's share of the year's passages. With use identical every day of the year, this formula would still read 33 %.
Quotations checked by ear against the recordings (Oct 6 webcast 0k_KZf9uxTk; Oct 19 webcast rii3nUTuKRE, 41:44 and 7:38:24; CBC Daybreak Oct 9, 07:03).
4The weather: last winter, and the day behind the "8"
- January 29, 2025, the day of the "8": 7.4 cm of snow, high -8.2 °C, low -14.7 °C, gusts to 40 km/h, under an Environment Canada winter weather advisory. The same temporary camera recorded cars on the Terrebonne approaches down 23 % and pedestrians down 26 % from its November count.
- The citizen sensors on that day still counted 21 bicycles at King Edward and 57 at Draper in daylight, both directions, against 11 and 22 the day before.
- Last winter, 72 % of the eastbound winter passages at Kensington were made on days with no snow-removal constraint on parking.
Sources: Environment Canada daily data, station 7025251; City snow-loading open data (2026-300 exposure analysis); Miovision tables, 2026-581 bundle 01, pp. 82–164; Telraam hourly data.
5The timeline: decisions and requests of the current administration
- Feb 5 and 19, 2024Borough (3–2) and City council (unanimous) approve the protected lanes; built May–June 2024 with City funding.
- Nov 2, 2025Municipal election; new borough administration.
- Jun 10, 2026Borough engineers write that the elected officials' objective is to restore the parking lane; two concepts already reviewed internally; an "official, neutral, external" opinion wanted.
- Jun 17The City's street-design service (SUM) replies: the options « présentent plusieurs compromis importants sur le plan de la sécurité, du confort des usagers vulnérables et de la cohérence du réseau cyclable » (borough's own summary, Jun 22). Analysis withheld.
- Jul 13Fire department (SIM) opinion delivered; released fully redacted.
- Aug 13Mayor's office mandate in writing: a permanent bidirectional lane on one side, parking restored on the other.
- Aug 20Service request adds the winter removal as « mesure transitoire pour l'hiver 2026-2027 » (Volet 1) ahead of the permanent plan (Volet 2).
- Aug 25–26EXP offer and purchase order: $14,755, six weeks; council date fixed in advance. Storm-only closure listed among the scenarios.
- Sep 3 → Oct 2Kick-off; draft Sep 17; final note due Oct 2.
- Oct 6Council address: "99 %", "8 … 4 cyclists"; "this is what we're going to propose"; "it's going to be a test"; changes "before Christmas 2026".
- Oct 9Access request answered (508 pages; three key documents withheld). CBC interview: "40 a day to 30 a day"; "at least 50 to 60" spaces; "for now … permanent".
- Oct 19City council: "3 %" / "3.6 %"; « On n'a aucun problème à partager nos documents »; Le Devoir: the mayor's office writes « d'avril à décembre » kept, « au moins 60 places ».
- Nov 2, 2026Borough council adopts the offer to City council to make the change (3–2); 1,490-signature petition handed over; December sitting moved to Dec 1.
- Nov 16–17 → Dec 1City council accepts or not; then the borough's signage resolution (Dec 1, 18:30) and works "before Christmas".
Sources: council records CA24 170018, CM24 0179; access request 2026-581 (bundle 01, pp. 1–26); council webcasts; CBC Daybreak Oct 9; Le Devoir Oct 19. Documents and transcripts: github.com/OpenMobilityData. Prepared from public records for residents of Côte-des-Neiges–Notre-Dame-de-Grâce; figures reproducible from the Terrebonne-access-requests (2026-581) and Terrebonne-telraam repositories; this page is rebuilt from the data by build_poster.py.